


Mercado
October 16, 2026
As altas temperaturas industriais e a eficiência energética na ABM Week



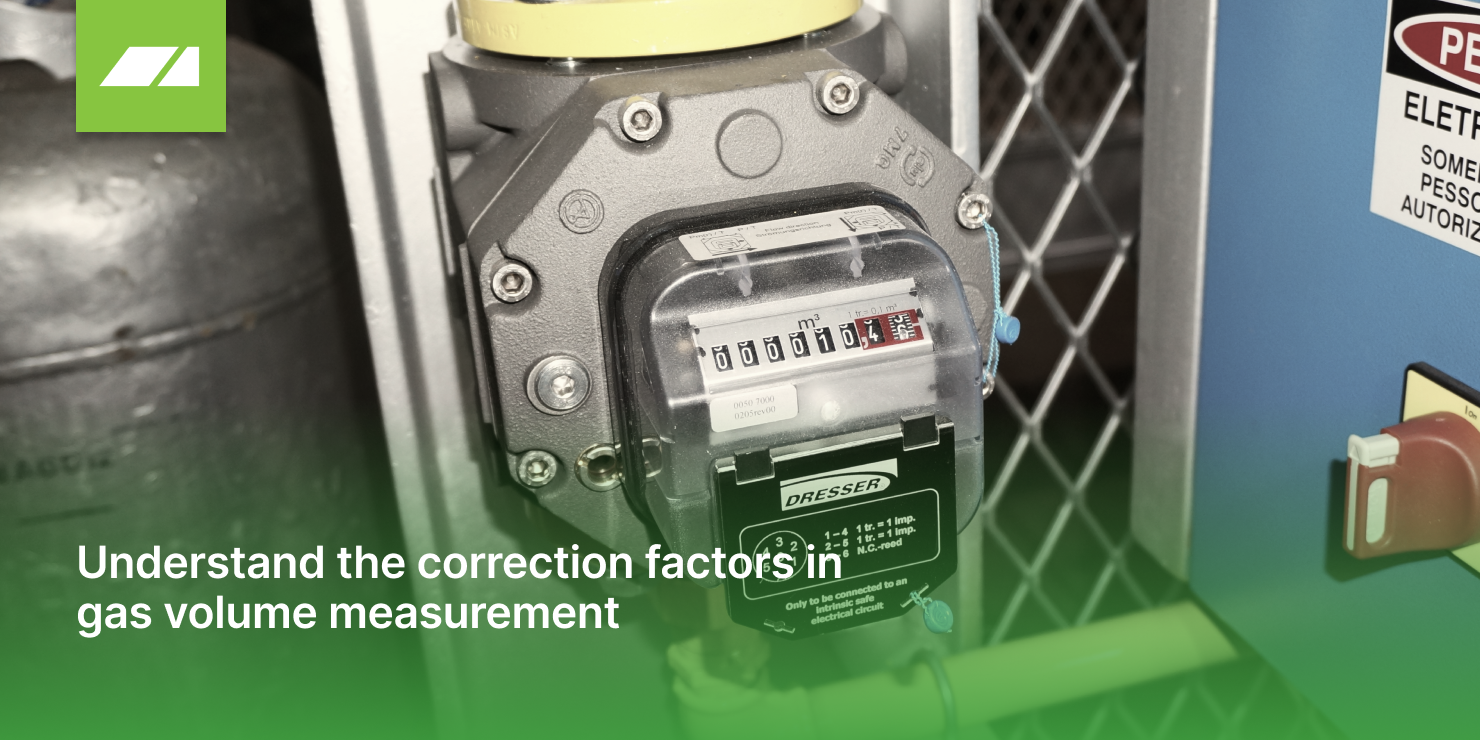
Most flow meters measure gas volume under the temperature and pressure conditions of the line. This measured volume (Vm) is known as the Actual or Real Volume.
However, gas characteristics and pricing are expressed under reference conditions of 20 °C and 1 atm, which we’ll call the BASE condition.
This often leads to confusion since both are expressed in m³. Many still refer to the volume at base conditions (Vb at 20 °C and 1 atm) as normal cubic meter (Nm³) — which is incorrect, as Nm³ refers to 0 °C and 1 atm.
This misconception leads to an error of 7.3%, as we will see later.
The purpose of this article is to explain how to correct the measured volume to the BASE condition, which represents the condition used for gas billing.
There are two main correction factors, derived from Boyle’s Law and Charles’s Law: the pressure correction factor and the temperature correction factor.
Let:
Fp = pressure correction factor
Pm = gas pressure at the meter installation point (in bar)
Patm = atmospheric pressure at the measurement location
Pb = base pressure specified by the gas supplier
Ft = temperature correction factor
Tb = base temperature specified by the gas supplier (in Kelvin)
Tm = gas temperature at the measurement point (in Kelvin)
To simplify calculations, the following correction table can be used, assuming atmospheric pressure = 1013 mbar (sea level).
A plant manager wants to determine the average gas consumption (m³/h) to calculate the production cost of a continuous furnace.
Two meter readings were taken:
Given that line pressure = 1.8 bar and local temperature ranged between 25 °C and 27 °C during this period, what is the average consumption to determine the process cost?
| Vm | Time | Difference | Fp | Ft | Vb | Period | Mean |
| [m³] | [hh:mm] | [m³] | - | - | [m³] |
hh:mm |
m³/h |
| 36987 | 8:03 | - | - | - | - | - | - |
| 37320 | 19:07 | 333 | 2.7769 | 0,9799 | 906 | 11:04 | 82 |
If, in the example above, the measured volume were used, the average would be 30 m³/h. However, because the goal is to determine process costs, the flow rate must be corrected to the supplier’s contractual base conditions—resulting in 82 m³/h.
Table for Temperature and Pressure Conversion:
| T (ºC) | Fts | T (ºC) | Fts | T (ºC) | Fts | T(ºC) | Fts |
| 0 | 1,0732 | 10 | 1,0353 | 20 | 1,0000 | 30 | 0,9670 |
| 1 | 1,0693 | 11 | 1,0317 | 21 | 0,9966 | 31 | 0,9638 |
| 2 | 1,0654 | 12 | 1,0281 | 22 | 0,9932 | 32 | 0,9607 |
| 3 | 1,0616 | 13 | 1,0245 | 23 | 0,9899 | 33 | 0,9575 |
| 4 | 1,0577 | 14 | 1,0209 | 24 | 0,9865 | 34 | 0,9544 |
| 5 | 1,0539 | 15 | 1,0174 | 25 | 0,9832 | 35 | 0,9513 |
| 6 | 1,0502 | 16 | 1,0138 | 26 | 0,9799 | 36 | 0,9482 |
| 7 | 1,0464 | 17 | 1,0103 | 27 | 0,9767 | 37 | 0,9452 |
| 8 | 1,0427 | 18 | 1,0069 | 28 | 0,9734 | 38 | 0,9422 |
| 9 | 1,0390 | 19 | 1,0034 | 29 | 0,9702 | 39 | 0,9391 |
| P (barra) | Fp | P (barra) | Fp | P (barra) | Fp | P (barra) | Fp |
| 0,0 | 1.0000 | 1,0 | 1.9872 | 2,0 | 2.9743 | 3,0 | 3.9615 |
| 0,1 | 1.0987 | 1,1 | 2.0859 | 2,1 | 3.0731 | 3,1 | 4.0602 |
| 0,2 | 1.1974 | 1,2 | 2.1846 | 2,2 | 3.1718 | 3,2 | 4.1589 |
| 0,3 | 1.2962 | 1,3 | 2.2833 | 2,3 | 3.2705 | 3,3 | 4.2577 |
| 0,4 | 1.3949 | 1,4 | 2.3820 | 2,4 | 3.3692 | 3,4 | 4.3564 |
| 0,5 | 1.4936 | 1,5 | 2.4808 | 2,5 | 3.4679 | 3,5 | 4.4551 |
| 0,6 | 1.5923 | 1,6 | 2.5795 | 2,6 | 3.5666 | 3,6 | 4.5538 |
| 0,7 | 1.6910 | 1,7 | 2.6782 | 2,7 | 3.6654 | 3,7 | 4.6525 |
| 0,8 | 1.7897 | 1,8 | 2.7769 | 2,8 | 3.7641 | 3,8 | 4.7512 |
| 0,9 | 1.8885 | 1,9 | 2.8756 | 2,9 | 3.8628 | 3,9 | 4.8500 |

As altas temperaturas industriais e a eficiência energética na ABM Week

A Perfil Térmico participou da 11ª Semana de Inovação com Fornecedores da Novelis, uma das principais referências mundiais em laminação e reciclagem de alumínio, e o encontro confirmou algo que acompanhamos de perto no dia a dia da indústria: as soluções mais consistentes surgem quando cliente e fornecedor trabalham juntos com a mesma visão.
Confira as etapas para calcular a economia do isolamento térmico do seu forno, com exemplo real de retorno em menos de 09 meses


